What skews and distorts suburb crime statistics
What skews and distorts suburb crime statistics?
If you are looking for a safe and peaceful place to live, you might be interested in checking out the crime statistics of different suburbs. However, not all statistics are accurate, and some suburbs have more crimes reported than they actually have. Why is that? In this blog post, we will explore some of the factors that can skew and distort the crime statistics of suburbs, and how Red Suburbs – Crime Map of Australia website handles them.
One of the factors that can inflate the crime rate of a suburb is the presence of shopping malls. Shopping malls attract a lot of visitors from other areas, and some of them may engage in shoplifting or other petty crimes. These crimes are reported in the suburb where the mall is located, even though they are not committed by the residents. Similarly, bottle shops can attract shady people who may cause trouble or violence in the vicinity. These factors can make a suburb seem more dangerous than it really is.
Another factor that can affect the crime statistics of a suburb is the location of certain institutions that report crime in bulk. For example, police stations, hospitals and state transport departments may report crimes that occurred in different areas under their jurisdiction, but they are counted as part of the suburb where they are based. This can create a false impression that the suburb has a high crime rate, when in fact it is just a reporting hub for other places.
A third factor that can influence the crime statistics of a suburb is the amount of infrastructure that it has. Some suburbs have low population density but a lot of roads, bridges, tunnels and other facilities that are used by people from other areas. These infrastructures can increase the chances of traffic violations, such as speeding, running red lights or driving under the influence. These violations are considered crimes and are reported in the suburb where they occurred, even though they are not related to the quality of life of the residents.
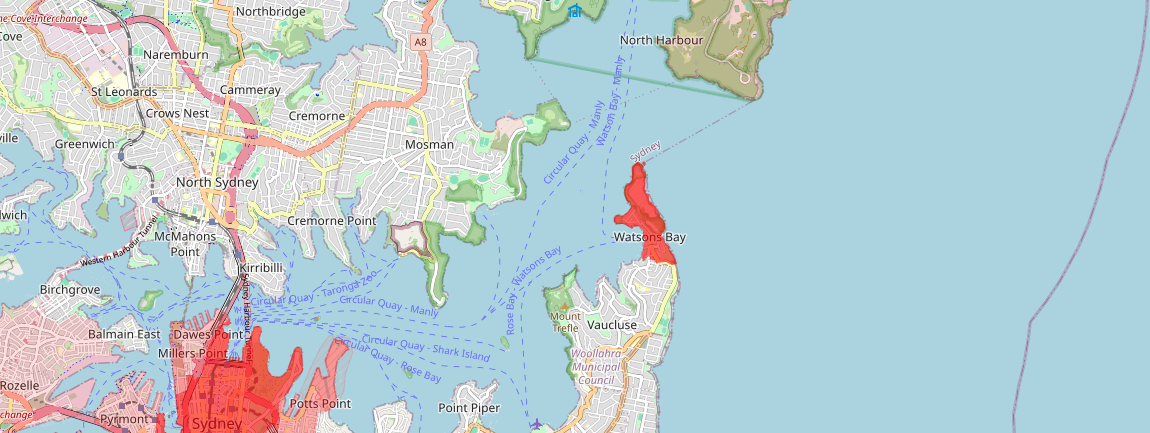
How does Red Suburbs handle these skewed and distorted suburbs? We use a sophisticated algorithm that identifies and puts a rank cap on such suburbs. This means that we do not rank them higher than they deserve based on their actual crime rate. We also provide detailed information about each suburb, such as its population, area and types of crimes reported. This way, you can analyse each suburb in depth and think about what factors can affect its crime statistics and drive its numbers up.
Red Suburbs tries to provide you with the most accurate and reliable crime map of Australia, but we also encourage you to use your own judgement and common sense when looking at the statistics. Not all suburbs are equal, and some may have more crimes reported than they actually have. By knowing what skews and distorts the crime statistics of suburbs, you can make a better decision about where to live or visit.
Related Posts

Is Sydney Safe
From the famous Sydney Opera House to the popular sands of Bondi Beach, Sydney is one of Australia’s most well-known cities. As the capital of New South Wales, it is a busy centre for education, business, and culture. Around 36 million people visit Sydney each year, including about 3.5 million visitors from overseas. But what […]
Read more
Most Dangerous Suburbs In Australia
When choosing where to live, safety is an important thing to think about. One way to understand how safe an area is is by looking at its crime statistics. Red Suburbs studied burglary statistics to find the main burglary hotspots in Sydney, Melbourne, Brisbane, Perth, and Adelaide. They also looked at hotspot areas in each […]
Read more