Blog Posts
![What Is The Safest State In Australia [2025]](https://redsuburbs.com.au/wp-content/uploads/2026/03/straya-360x360.jpg)
What Is The Safest State In Australia [2025]
Victoria is widely considered the safest state in Australia. Australia has long been known as one of the safest countries in the world, and that reputation continues in 2025. Recent crime reports and safety indexes show that many cities across the country maintain very low crime rates. From quiet suburban streets to the busy cities, […]
Read more![Is Melbourne Safe [2025]](https://redsuburbs.com.au/wp-content/uploads/2026/02/melbourne-360x360.jpg)
Is Melbourne Safe [2025]
According to Red Suburbs data, Melbourne is one of the safest cities in Australia to both live in and visit. I was born and raised in Melbourne and lived there for my first 22 years before moving to sunny Queensland. One thing most people will tell you about Australia’s second-largest city is that the weather […]
Read more
2024 ACT Data & WA Data fix
This is a quick update to highlight that 2024 ACT Data was added to the website. We also discovered that there was an issue with our WA data due to a bug in data extraction process, which resulted in ~90,000 crimes missing from our database. WA police change their way of reporting this year, and […]
Read more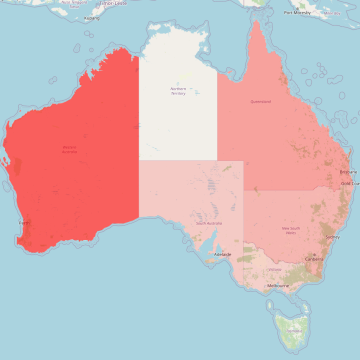
Unequal Distribution Of Violence
If you look at a crime map of Australia, you’ll see that some places have more violent crimes than others. For example, New South Wales (NSW) has the most cases of assault and similar crimes in the country.
Read more![10 Most dangerous suburbs in Sydney [2023 data]](https://redsuburbs.com.au/wp-content/uploads/2025/01/Sydney_CBD_northeast_view_20230224_1-360x333.jpg)
10 Most dangerous suburbs in Sydney [2023 data]
Based on State Police Crime statistics from Red Suburbs – Crime Map of Australia for 2023, the most dangerous areas in Sydney have been identified. Curious if any high-risk suburbs are near your neighbourhood? Keep in mind that safety levels vary significantly across different parts of Sydney. Overall, the Northern Quarter is considered the safest […]
Read more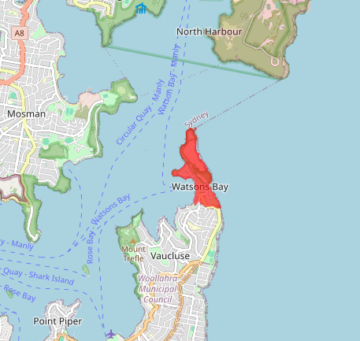
What skews and distorts suburb crime statistics
Not all statistics are accurate, and some suburbs have more crimes reported than they actually have. Why is that? In this blog post, we will explore some of the factors that can skew and distort the crime statistics of suburbs
Read more
2022 crime data, new ranking, Crime API
Good news everyone! Red Suburbs now updated with 2022 crime data statistics for all of Australia. Crime trends are now expanded to 5 years, 2018 to 2022. This provides much better overview of where crime is heading for each particular suburb. For first 4-5 months Red Suburbs experimented with new ranking algorithm based on median […]
Read more![The 37 Best Free Property Research Tools [2022]](https://redsuburbs.com.au/wp-content/uploads/2022/06/post-image-360x360.jpg)
The 37 Best Free Property Research Tools [2022]
Free Property Research Tools for Property Search, Financial Indicators, Suburbs profiles, Crime profiles, Suburb traits, Sale history, Land and Zone info
Read more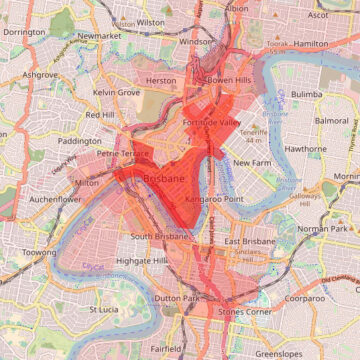
Brisbane Crime Suburbs – Top 5 (2022)
Highest crime suburbs of Brisbane rating per capita adjusted for crimes severity:
1. Brisbane CBD – 100
2. Fortitude Valley – 93
3. Bowen Hills – 52
4. South Brisbane – 52
5. Woolloongabba – 48