Brisbane Crime Suburbs – Top 5 (2022)
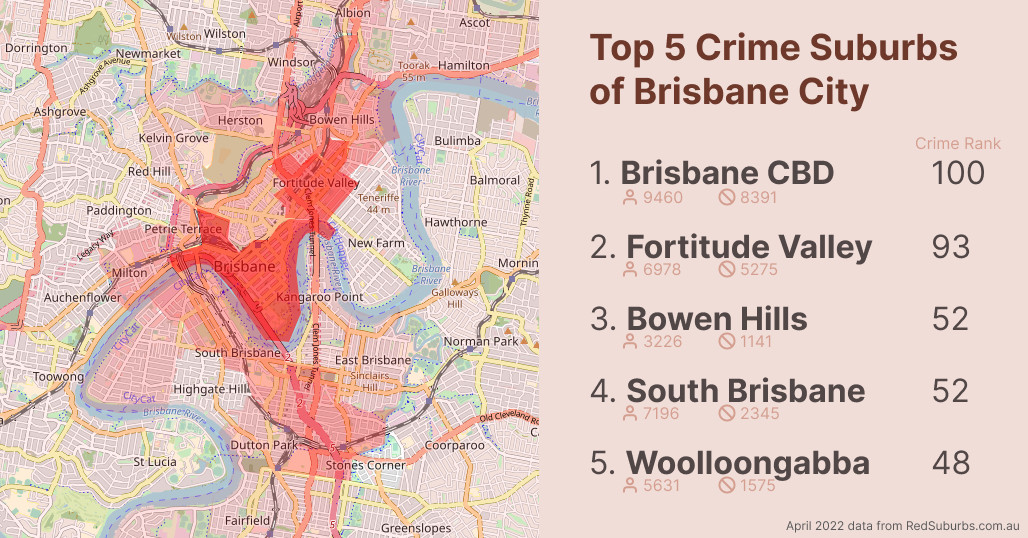
If you rent or plan to buy it is important to know crime situation in your target area. These are top 5 Brisbane crime suburbs and their detailed statistics.
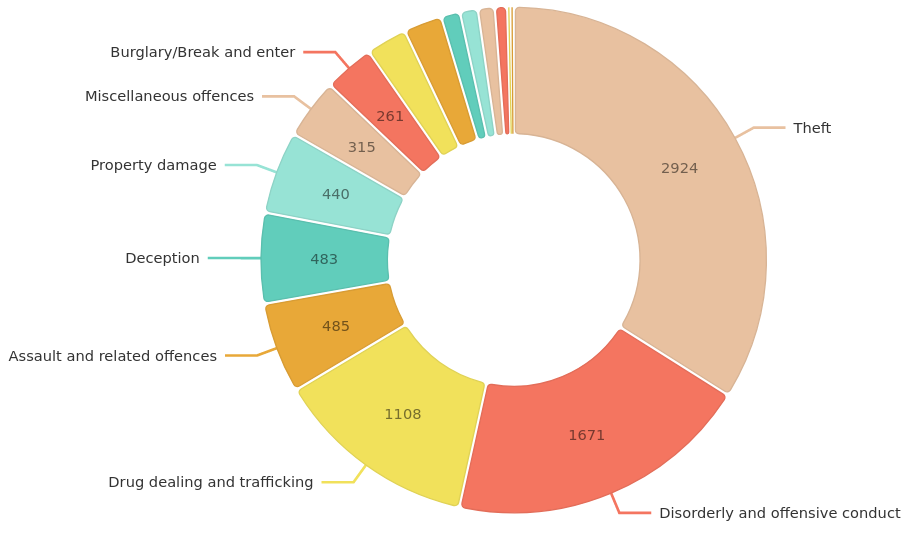
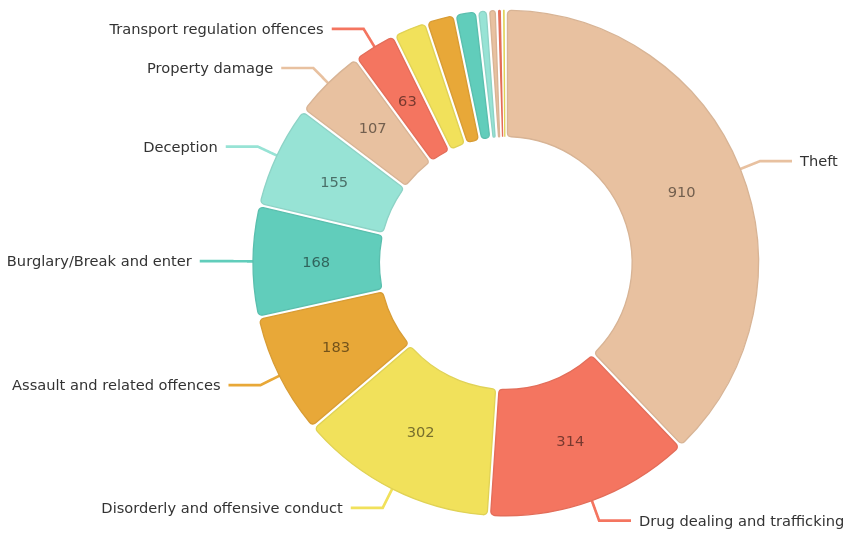
Brisbane CBD – Crime Rank 100
Population: 9460
Total Crimes: 8391
Largest by population the Brisbane CBD area is also highest in crime. Yearly cases of theft, disorderly & offensive conduct and drug offences are in thousands. With high activity and cultural life in the area high crime comes as well.
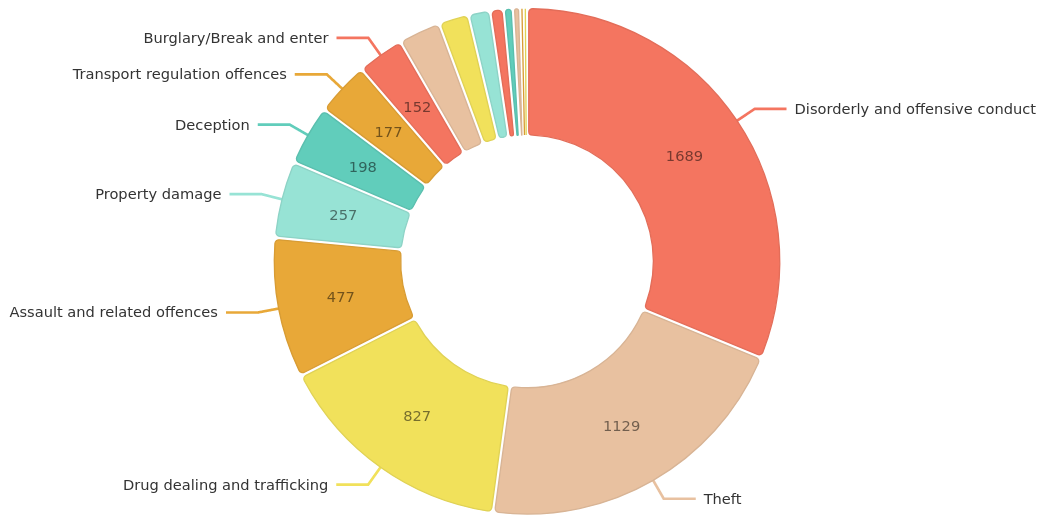
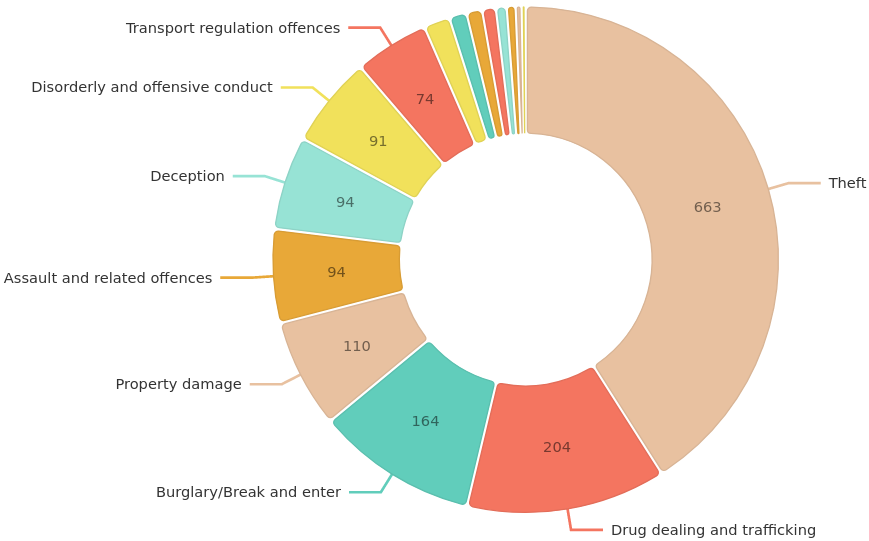
Fortitude Valley – Crime Rank 93
Population: 6978
Total Crimes: 5275
This is only suburb in our top 5 that has disorderly & offensive conduct higher than theft. This is most probably related to famous night life of Fortitude Valley. Sadly night life also creates crimes, often in intoxicated state.
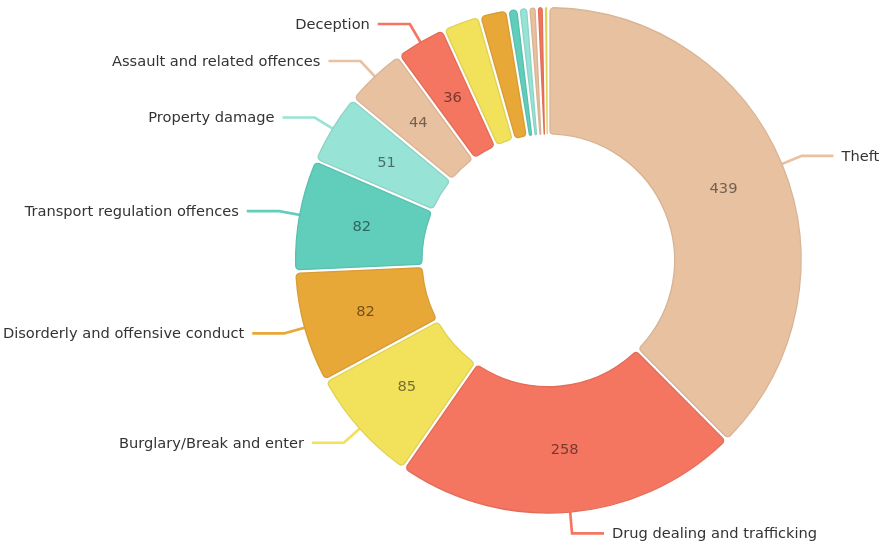
South Brisbane – Crime Rank 52
Population: 3226
Total Crimes: 1141
South Brisbane area while still have Theft as prime category of crime also has particularly large share of drug related offences. Break and entry category also has larger share. This area while providing large number of cultural and entertainment events obviously has it’s share of problems.
Bowen Hills – Crime Rank 52
Population: 7196
Total Crimes: 2345
With similar picture to others in our top 5 of Brisbane crime suburbs, it has differences. Most important to notice significantly larger share of assaults and related offences in Bowen Hills. This can be a red flag for renting in the area and signal that is it not family friendly.
Woolloongabba – Crime Rank 48
Population: 5631
Total Crimes: 1575
The primary highlight for Woolloongabba crime is very large share of break and enter crimes #3 and other property damage crimes #4. This can be a red flag for property ownership in that suburb.
Related Posts
![What Is The Safest State In Australia [2025]](https://redsuburbs.com.au/wp-content/uploads/2026/03/straya-360x360.jpg)
What Is The Safest State In Australia [2025]
Victoria is widely considered the safest state in Australia. Australia has long been known as one of the safest countries in the world, and that reputation continues in 2025. Recent crime reports and safety indexes show that many cities across the country maintain very low crime rates. From quiet suburban streets to the busy cities, […]
Read more![Is Melbourne Safe [2025]](https://redsuburbs.com.au/wp-content/uploads/2026/02/melbourne-360x360.jpg)
Is Melbourne Safe [2025]
According to Red Suburbs data, Melbourne is one of the safest cities in Australia to both live in and visit. I was born and raised in Melbourne and lived there for my first 22 years before moving to sunny Queensland. One thing most people will tell you about Australia’s second-largest city is that the weather […]
Read more